Queries and Reports
One reporting layer over all your connected systems, with saved queries, scheduled PDF reports in your company's own look and safe staging copies.
See this on the STRAX product page →
One place to ask questions of all your data
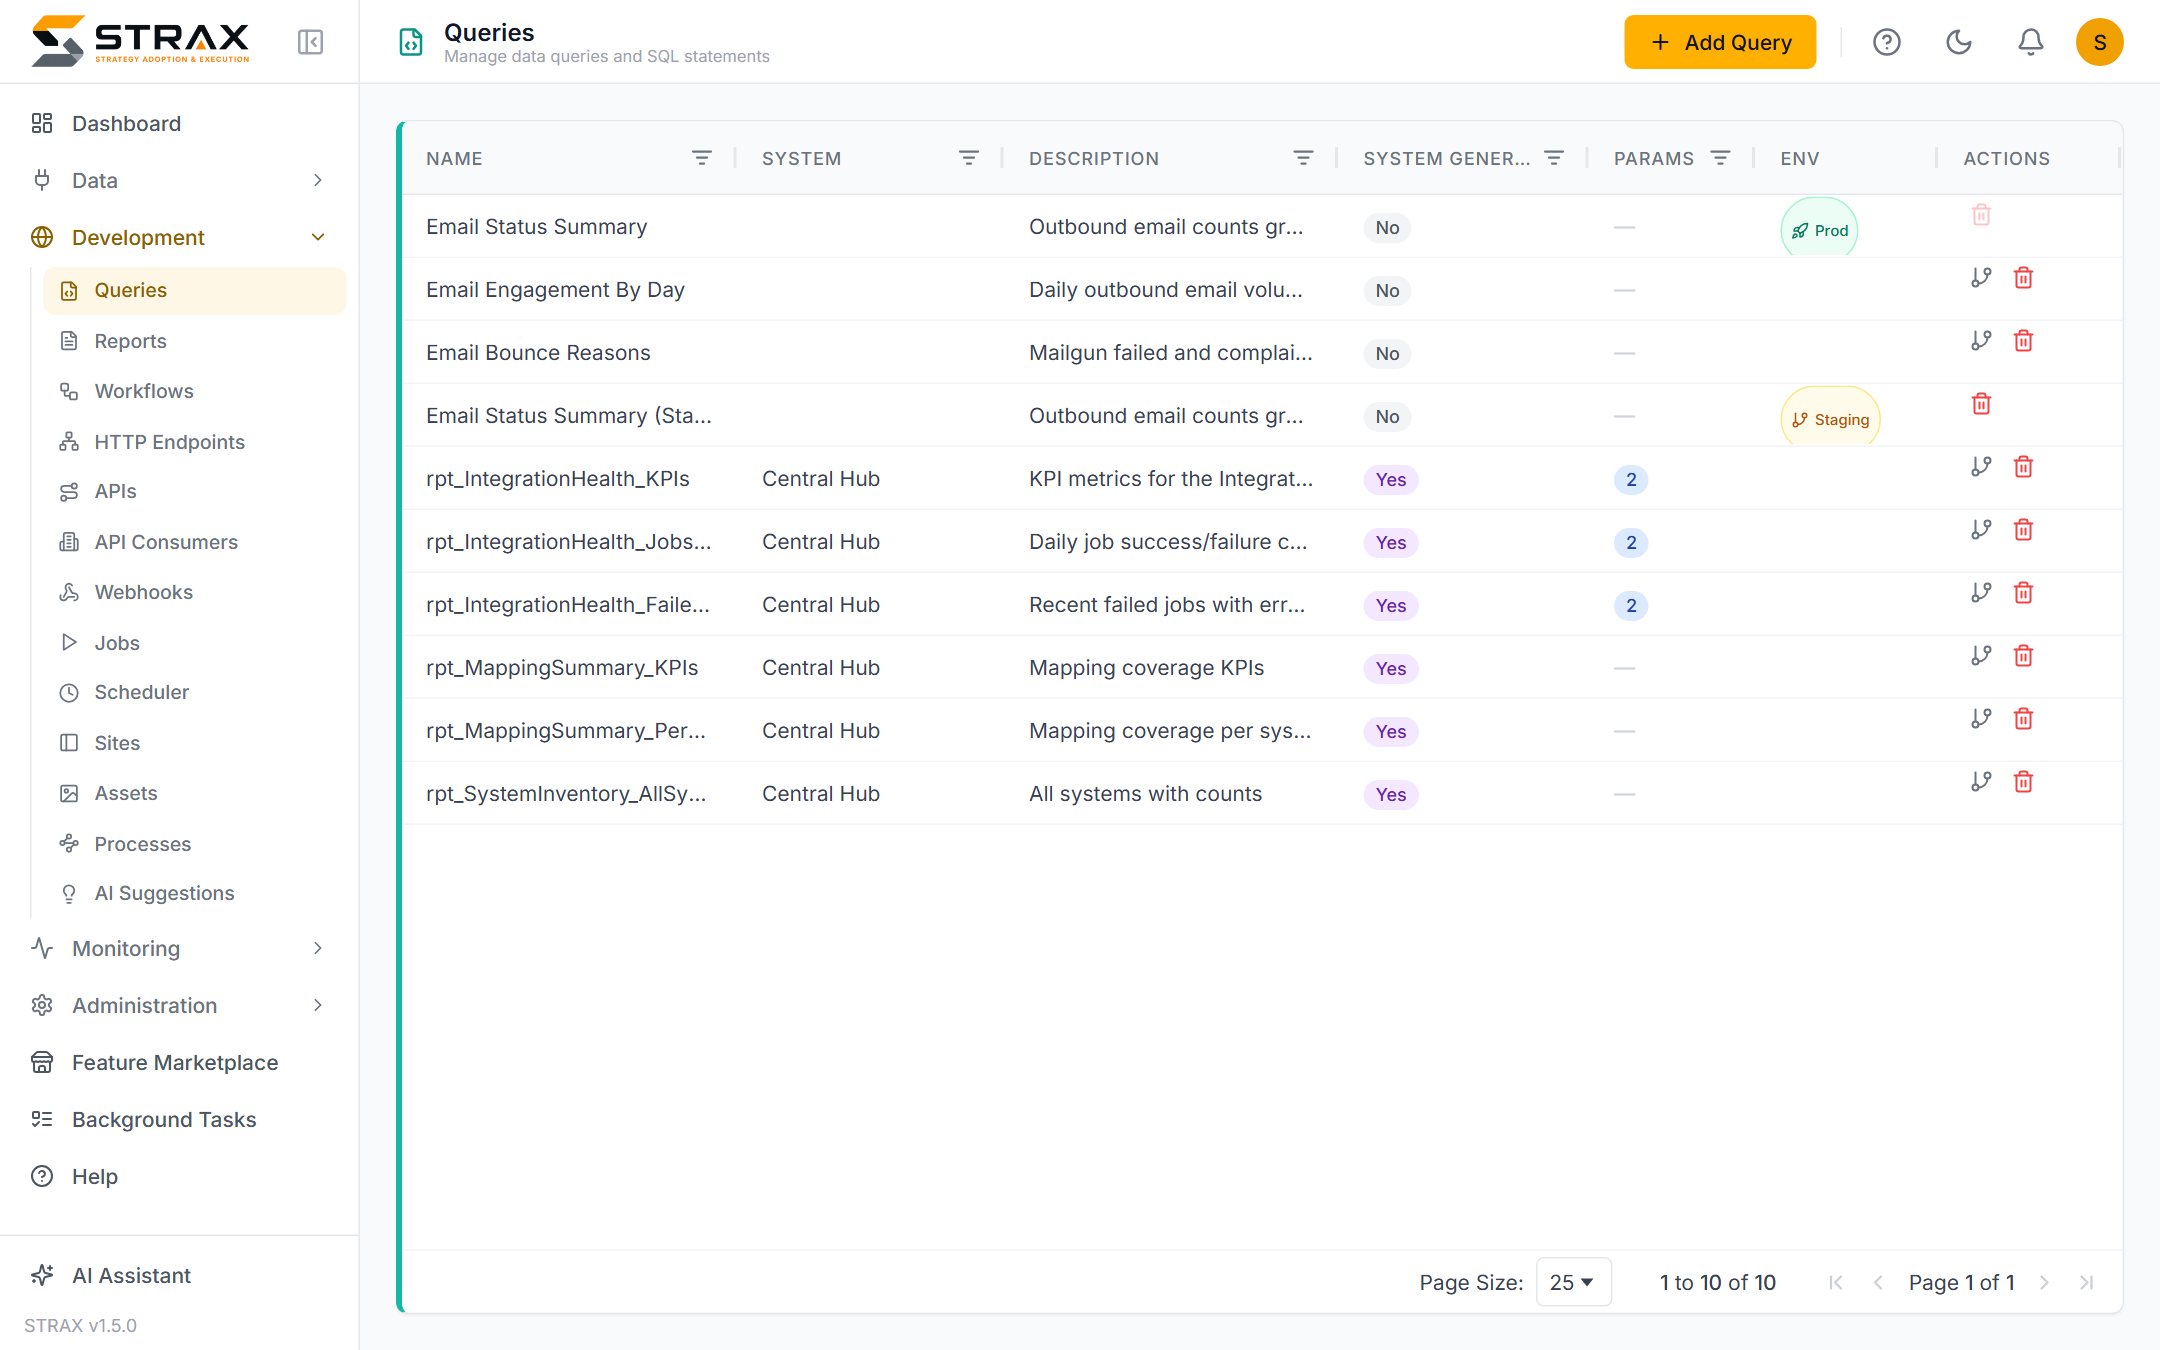
Once your systems feed the hub, reporting stops being a per-system exercise. A saved query in STRAX runs over the consolidated hub data, so a single question can span billing, support, sales and network inventory at once. Demo ISP can list every customer with an overdue Splynx invoice and an open Zendesk ticket in one query, because both systems already land in the same place.
Queries are named, described and kept in the console, so the organisation builds a library of agreed definitions rather than a folder of one-off spreadsheets. When two people ask for monthly revenue, they run the same query and get the same answer.
As the library grows, tags keep it navigable. Queries, reports and scheduled jobs can carry free-form tags such as "finance" or "month-end", and each list can be searched, filtered and grouped by them, just as workflows can. Tags travel with the item into staging copies, promotions and packages.
Parameters make one query serve many cases
A query can declare parameters such as a month, a region or a customer, each with a label, a data type and a default. One revenue query then serves every branch and every period, instead of a near-identical copy per case. Results appear in a grid in the browser, and a full result set can be downloaded as a CSV file. A long-running query can be sent to the background, so the console stays usable while it completes.
A query can also carry a chart definition, choosing a bar, line, area or pie presentation with its labels and values. The same chart then appears everywhere the query is used, in reports and on portal pages alike.
Reports that present themselves
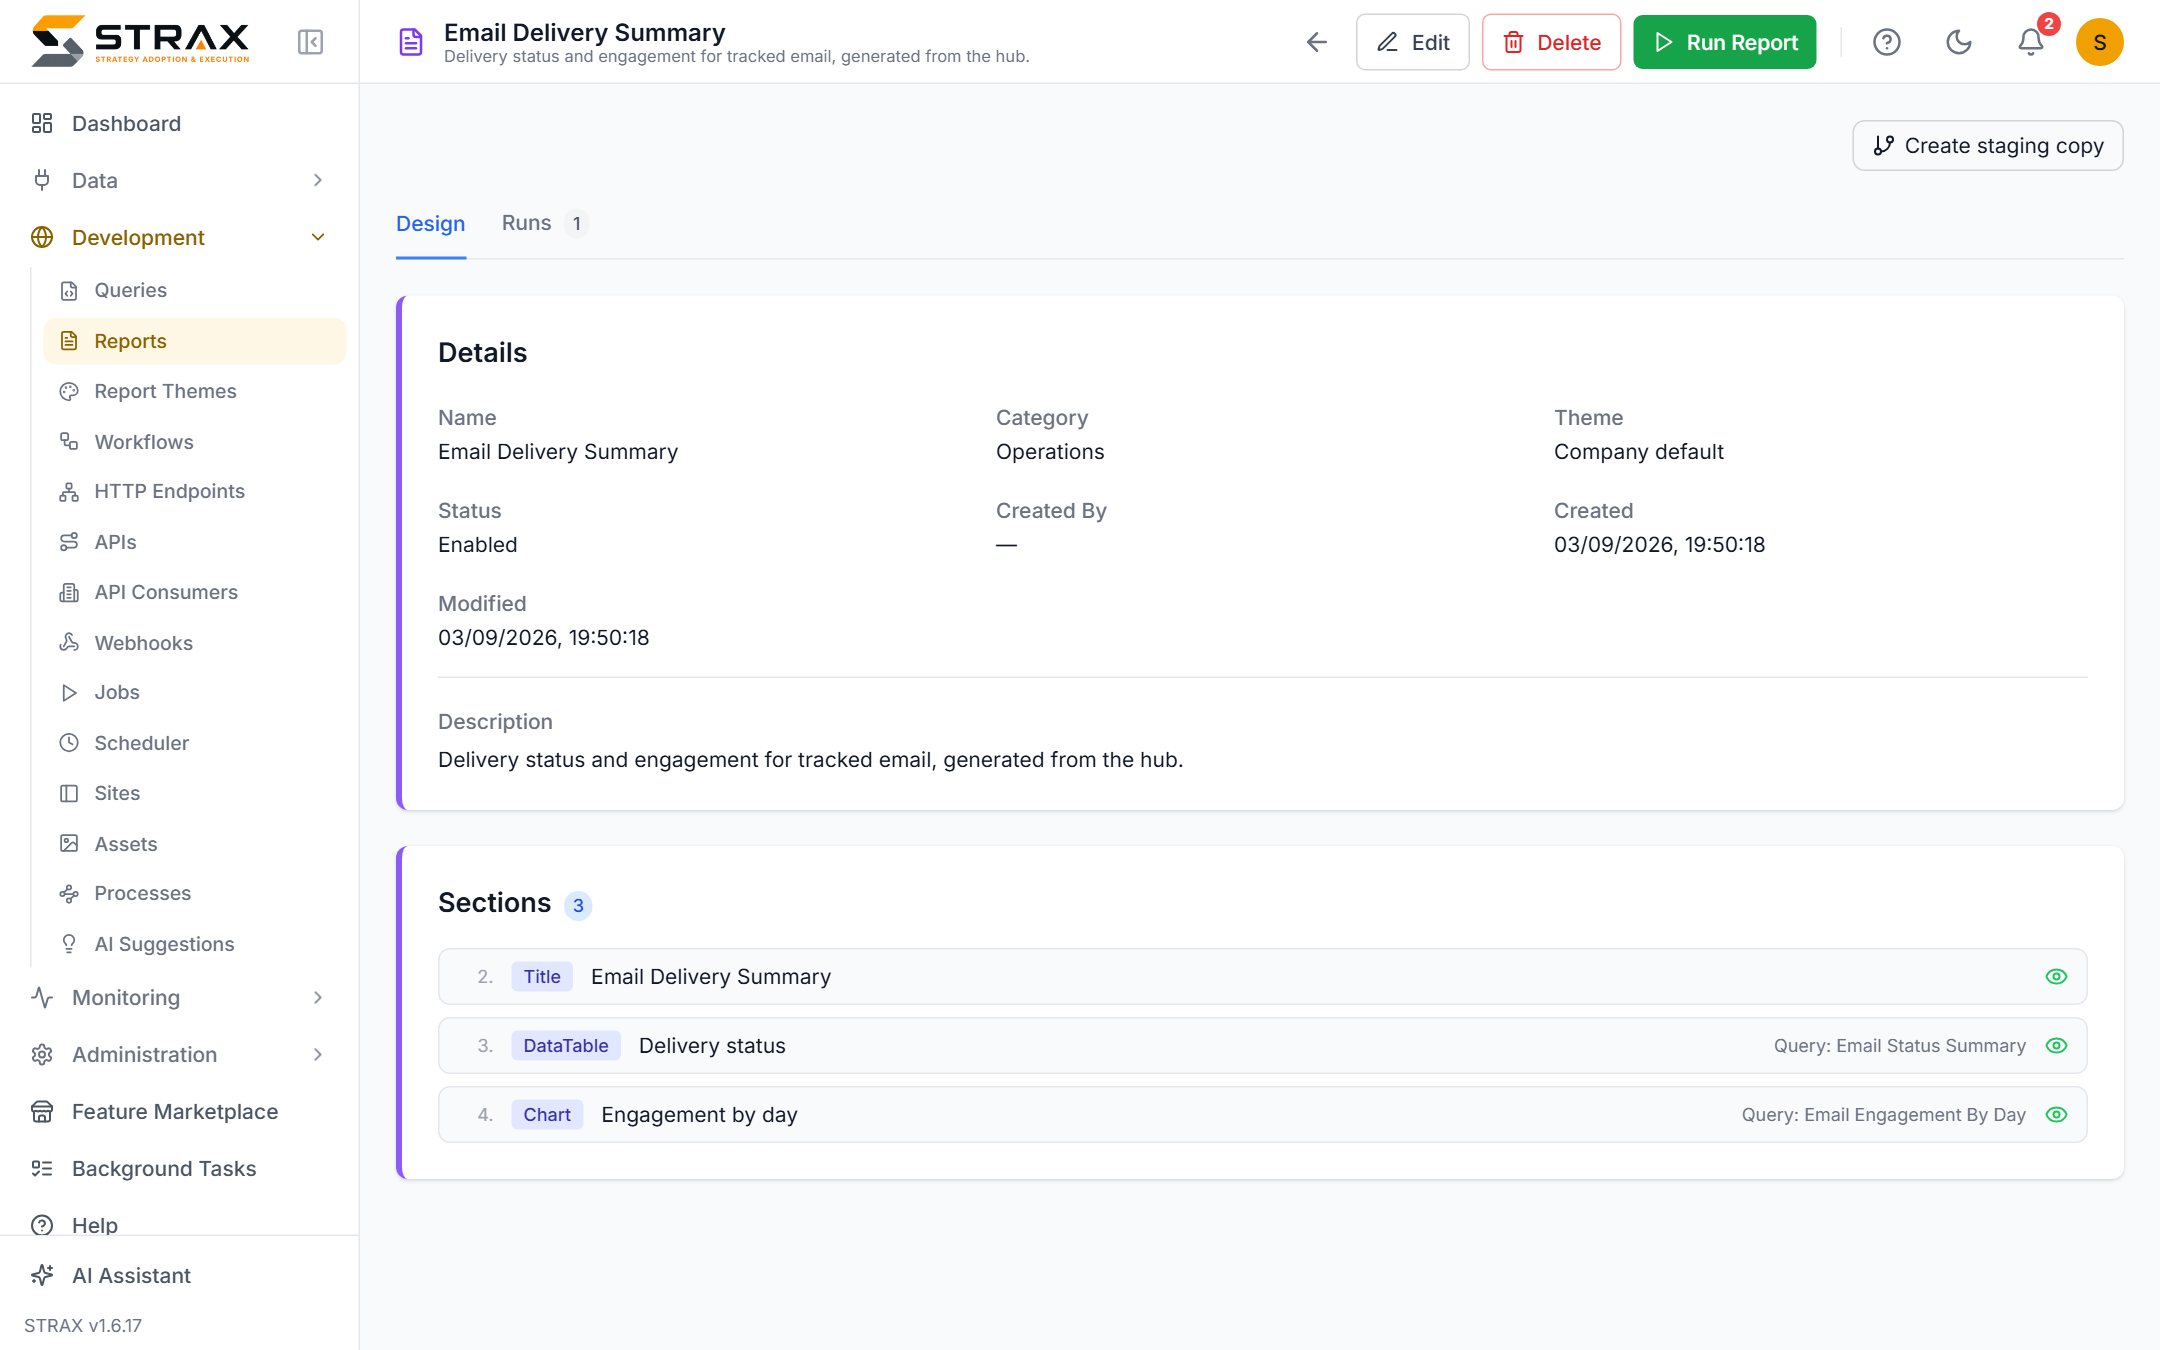
The report designer turns queries into finished PDF documents. A report is an optional cover page plus a series of sections, each backed by a query and rendered as a table, a chart or both. The designer concentrates on content, meaning which questions the report answers and in what order. How the report looks belongs to its theme.
Reports run on demand, on a schedule or from a workflow. A scheduled report generates itself and emails the result, so the Monday operations summary arrives before anyone asks for it. Every run is retained with its parameters, page count and the PDF as generated, which preserves what was actually sent even after the underlying data has moved on.
Reports are built to finish. A stray emoji in a ticket subject or a symbol the theme's fonts cannot draw is left out of the PDF and listed in a warning, instead of stopping the report. A workflow that sends a report and a report that runs a workflow can never set each other off in an endless loop: STRAX refuses to save such a loop and names the path that would close it.
Every report in your company's look
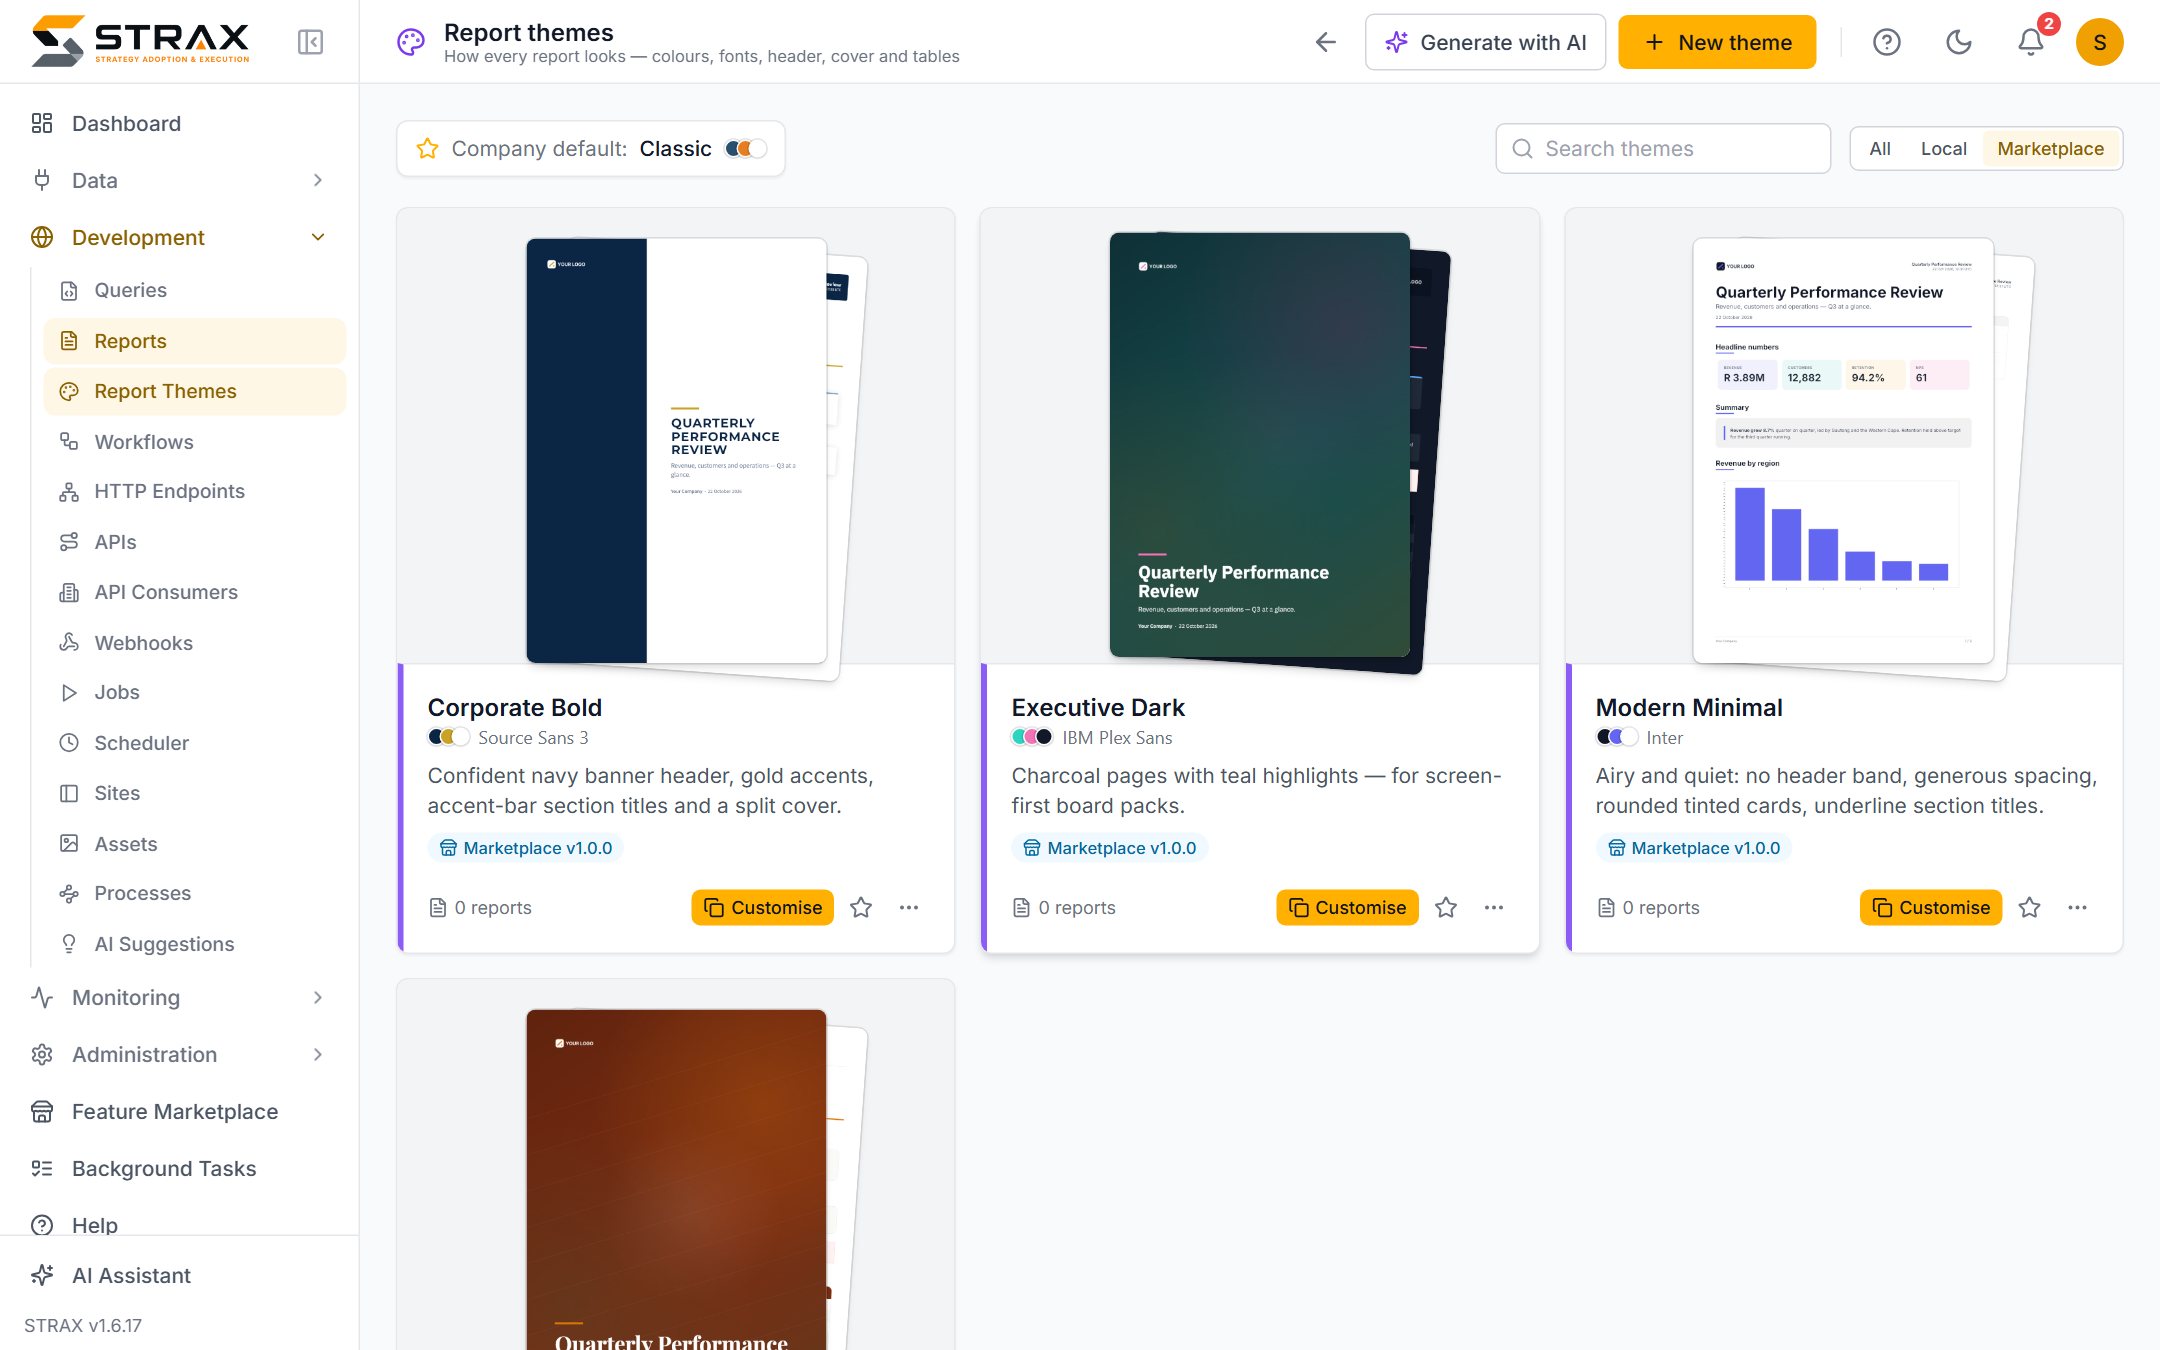
A report theme is the shared look of your reports: logo, colours, fonts, header and footer, cover page, tables, charts and page layout. One theme is the company default, and every report that does not ask for a different look uses it. Change the default and all of those reports carry the new look from their next run, so a rebrand is one change rather than an afternoon of editing reports one by one. A report that genuinely needs its own look, such as a customer-facing pack in that customer's colours, can name a theme of its own.
Building a theme does not need a designer. Start from a ready-made starter, add your logo and cover photos, and STRAX suggests colours drawn from the logo. A live preview shows a sample report, cover to last page, as you work. Readability is checked throughout: a theme whose text would be hard to read, such as pale grey on white, is not saved, and the problem is shown beside the setting with a suggested fix.
Demo ISP set its own theme as the company default once. Its board pack, its operations summary and every departmental report now share the same logo, colours and cover.
Ready-made, or designed by AI
The marketplace carries ready-made themes. An installed theme stays exactly as its publisher made it, so later versions can update it. To make one your own, customise it: you get an independent copy to adjust with your logo and colours, and future updates never overwrite your changes.
Built-in AI can design a whole theme from a short brief, such as "navy and gold, a photo cover of our building, modern and airy", using your own logo and photos. It can also change an existing theme from an instruction such as "darker header, rounder cards". Every AI design passes the same readability checks as a manual edit, and nothing is saved until a person has seen the preview and accepted it.
Replacing per-system exports
The practical outcome is one reporting layer instead of five export routines. Nobody downloads a CSV from Splynx, another from HubSpot and a third from NetBox to assemble a picture in a spreadsheet. The joining has already happened in the hub, and the report reflects it. When a new system is connected, existing queries can reach its data as soon as it is mapped, with no change to the reporting tooling.
Change safely with staging copies
Queries, reports and report themes all participate in STRAX's staging and production model. A production query that a live portal or a scheduled report depends on is not edited in place. You create a staging copy, make and test the change there while the production version continues to serve, and push the result when it is right. A new look is tried the same way, so a theme is previewed and refined before any production report wears it. Version history means a push that turns out to be wrong can be restored.
Where this fits
Queries also power the data modules on portals and can be called from workflows, so one definition serves screens, documents and automation. For the wider picture, see What is STRAX? and the use cases, or request a quote to see your own data in a report.